*Disclaimer* - This article uses free licensed 30-day evaluation version of ADS by Keysight (courtesy).
> Loading schematic to your workspace:
- If there is an existing schematic that you would like to load:
- Go to ADS (Main) screen.
- Click File > Open > select schematic available in your 'workspace_lib'.
- To add schematic to your workspace_lib folder, you may copy the schematic folder to your workspace_lib inside the workspace folder.
- If the Main ADS window does not show the schematic or output file, press F5 function key to Refresh.
- Loading PDK (Process Design Kit) - 180nm in this case to your ADS (free trial):
- ADS Main screen menu > manage libraries > Add Library Definition File > browse Folder of the available PDK > select 'lib.defs'
- Once the PDK library is selected, it will show all the transistor types, as shown in the below image:
- Use the 'Netlist include' to create/run any simulations (compulsory).
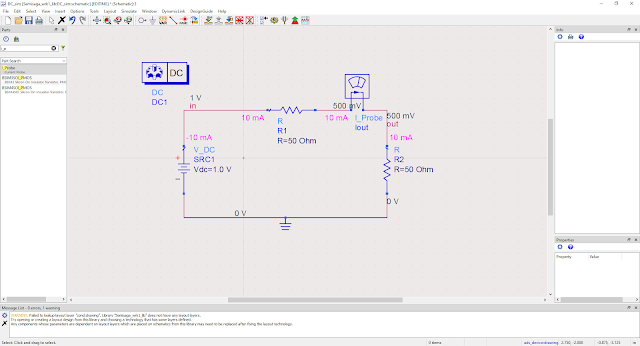
- For a DC Type of simulation, use the DC simulation component with the circuit that is being built:
- Use 'note name' - in and out for input and output as shown respectively:
- To see DC Annotations - Current and Voltage values, see the below image:
- Simulating using current probe (i_probe):
hpeesofsim (*) 600.shp Apr 3 2024, MINT version 5
(64-bit windows built: Wed Apr 03, 2024 19:25:42 +0000)
***** Simulation started at Tue Aug 20 22:43:02 2024
Running on host: "PC-1"
In Directory: "C:\Users\PC\OneDrive\Desktop\Semisaga_ADS_wrk\Semisaga_wrk1\data"
Process ID: 15168
DC DC1[1] <Semisaga_wrk1_lib:DC_sim:schematic>
.
DC convergence achieved in 29 iterations.
Resource usage:
Total stopwatch time = 11.15 seconds.
***** Simulation finished at Tue Aug 20 22:43:13 2024
-------------------------------------------------------------------------------
Simulation finished: dataset `DC_sim' written in:
`C:\Users\PC\OneDrive\Desktop\Semisaga_ADS_wrk\Semisaga_wrk1/data'
-------------------------------------------------------------------------------
.png)
- DC Sweep for the above circuit shown below. Markers m1, m2, and m3, can be used to observe the values. If Current is decreasing, the Voltage is increasing:
.png) |
| Extended Table Plot (R2 till 50 Ohm) |
.png) |
| m1, m2, m3, markers at R2 = 26 |
.jpg)
.png)


.png)

.png)
.png)
.png)
.png)
.png)
.png)
.png)
.png)
Comments
Post a Comment